
Is there a Place for Manual Data Analysis in Today’s World of AI?
Technology
MS Word
Project Duration
1 weeks
Role
Qualitative Data Analyst
Qualitative data analysis is an essential part of research, providing insights into people’s opinions, behaviours, and experiences. It involves analyzing non-numerical data, such as interview transcripts, surveys, and audio recordings, to identify patterns and themes. Traditionally, qualitative data analysis has been done manually, which can be time-consuming and prone to errors. The rise of automation and artificial intelligence (AI) has transformed the way we analyze data. With the advent of powerful software tools and machine learning algorithms, researchers now have access to a range of automated methods for qualitative data analysis. However, the question remains: is there still a place for manual data analysis in today’s world of automation and AI?
Manual qualitative data analysis involves analyzing data by using highlighter pens, paper or Microsoft Word. The manual approach is still widely used today, particularly in fields such as anthropology, sociology, and psychology. Researchers who use this method often argue that it provides a more nuanced understanding of the data than automated methods. However, the manual process has several limitations. It is a time-consuming process that requires a high level of expertise and it is prone to errors, particularly when multiple researchers are involved.
Our use case in demonstrating the manual data analysis process is based on the case study: A content analysis of YouTube comments about coping with SAD. (Read the case study here)
Manual Qualitative Data Analysis Process: Deductive Content Analysis
The qualitative content analysis process consists of six major steps: selecting the unit of analysis, familiarization, developing a coding frame, categorization, revision and reporting.
Step 1: Select the unit of analysis
Units of analysis are the materials to be analysed and their selection is guided by the research question.
Despite awareness of SAD and coping strategies in the literature, there’s a lack of empirical research on the coping strategies used by people with SAD in Kenya. A few people have used social media- YouTube – to raise awareness of SAD. Hence, user comments were selected as the units of analysis.
Step 2: Make sense of the data
The purpose of this step is to become immersed in the data. The analysts reads through the data multiple times. Asking the WH- questions helps the analyst to learn what is going on and identify concepts relevant to the research question. Familiarization is particularly important for analysts working with data that was collected by another researcher.
Step 3: Develop a categorization frame
The data is then categorized using an inductive or deductive approach. An inductive approach is appropriate when there’s little or fragmented knowledge about the phenomena of interest. A deductive approach is used to retest an existing theory, model, concepts or categories in a new context. Research on coping with stressful events began in the 1980s and several models have been developed to identify the basic dimensions of coping. As such a deductive approach was appropriate for our use case.
The analyst determined and defined two main categories – emotion- and problem-focused coping strategies based on the transactional model of stress and coping developed by Lazarus and Folkman (1987). Next, the analyst determined the operational definitions for each category using the model.
Step 4: Categorization
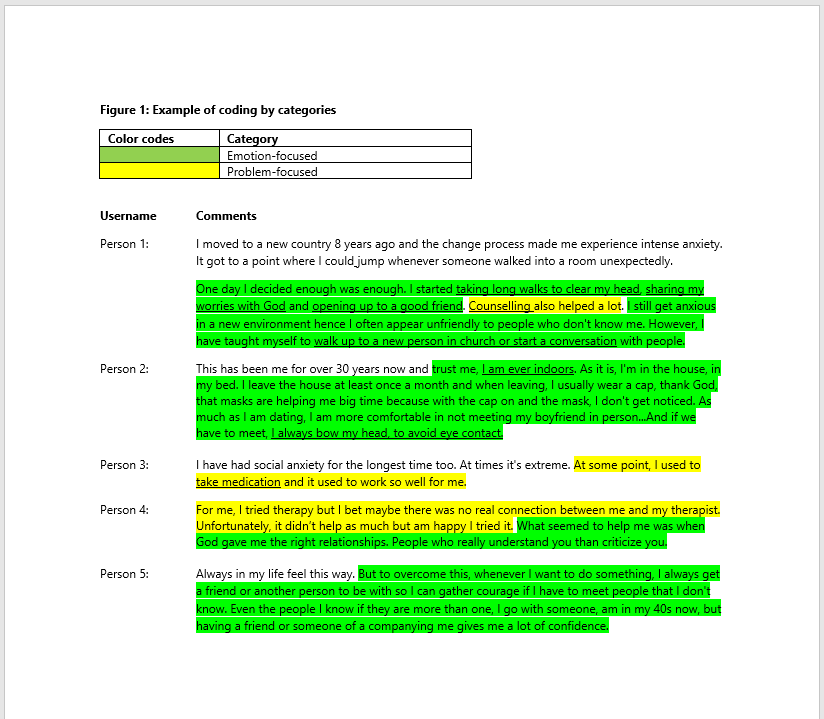
The research materials are read and all text that on first impression appears to represent a predetermined category is highlighted. Any text that does not fit into these categories is assigned a new category. For our use case, user comments that were related to problem-focused coping strategies were highlighted in yellow while sections of the comments relating to emotion-focused strategies were highlighted in green. A sample of this categorization is provided in Figure 1.
Step 5: Develop subcategories
In this step, the broad categories are broken to capture the varied ideas. All the text put in one category is read line-by-line. Smaller sections of text (words, phrases, sentences et cetera) that have meaning in relation to the research question(s) are assigned a label that captures the meaning. These labels become sub-categories under the broad categories and can be data-driven or derived from theory. Going back to our example, the emotion-focused strategies were broken into avoidance, exercises and seeking social support based on the transaction model. An example is provided in Figure 2.

The final step includes reviewing the categories and subcategories and interpretation of results.
Need help with conducting deductive content analysis? Contact QDH to get started.
As the amount of data that researchers collect continues to grow, manual qualitative data analysis is becoming increasingly impractical.
Automated Qualitative Data Analysis
Automated methods such as data analysis software, AI and generative AI are becoming increasingly popular. These tools use machine learning algorithms and natural language processing to identify patterns and themes that might be missed by manual analysis, providing new insights into the data. They also analyse data quickly and accurately, saving researchers time and effort. There are several automated tools for qualitative data analysis, including:
- Data analysis software: Software tools such as Dedoose, NVivo, and Atlas.ti use machine learning algorithms to identify recurring themes, sentiments, and patterns within qualitative data, making it easier for researchers to extract meaningful insights. By automating parts of the analysis process, these tools reduce the time and effort required for manual coding and categorization.
- AI tools use methods such as Natural Language Processing (NLP) to understand human language. NLP tools can be used to identify sentiments, patterns and themes in the data, such as social media posts, interview transcripts, surveys, and audio recordings.
- Generative AI: ChatGPT: Generative AI tools such as ChatGPT utilize neural networks, to identify patterns, themes and relationships from data. These tools generate alternative interpretations of qualitative data allowing researchers to explore novel angles and perspectives.
Limitations of Automated Methods
There are several limitations of automated methods for qualitative data analysis. One of the main limitations is that automated methods can be expensive and require specialized training. Researchers must have a good understanding of the algorithms used by these tools to ensure that they are being used correctly. Additionally, automated methods may not be able to capture the full range of human experiences and emotions. This can be particularly problematic in fields such as psychology and sociology, where understanding human behaviour and emotions is critical.
Conclusion
In conclusion, there is still a place for manual data analysis in today’s world of automation and AI. The manual approach allows researchers to gain a deeper understanding of the data and identify nuances that might be missed by automated methods. However, as the amount of data that researchers collect continues to grow, automated methods are becoming increasingly popular. While automation enhances efficiency and the rigor of qualitative analysis, human interpretation and context are still crucial for meaningful insights. Researchers must therefore consider the advantages and disadvantages of each method before deciding which one to use.
